Urban heat islands explained
Why is it hotter in the city than in the countryside? The explanation lies in three letters: UHI, for urban heat island.

Yann Daoulas
Why is it hotter in the city than in the countryside? The explanation lies in three letters: UHI, for urban heat island.
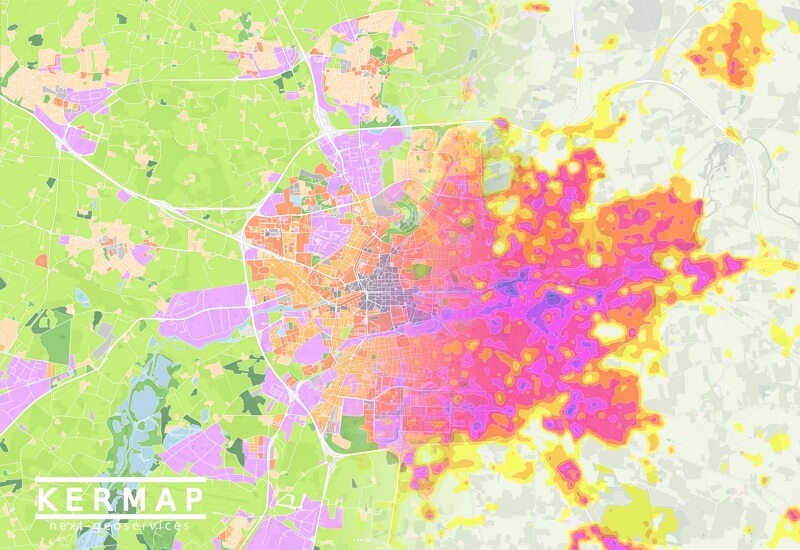
In city centers and in urbanized areas, we observe an increase in ground and air temperatures compared to the outskirts. The differences between the city center and its surroundings can reach 10 °C. The consequence is the creation of thermal domes which will shelter artificial microclimates. These themperature discrepancies are made clearly visible through satellite imagery. Day and night surface temperature gradients of a territory can indeed be observed using earth observation data. Analyzing them help identify urban heat and cool islands at city or a district level, and possibly understand their origins.
Heat islands proceed from the configuration of the urban environment and man-made warming. And they have many negative consequences for humans as well as the environment. Risks to health, threats to biodiversity, feelings of discomfort are among the issues posed by urban heat islands, which also question the adaptability of our infrastructures. Indeed, many facilities were not designed to combat the heat. A vicious circle ensues, as certain comfort facilities such as air conditioning accentuate the phenomenon by evacuating heat outside. Real solutions exist and must be implemented to remedy this phenomenon, which will increase in the coming years.
Indeed, cities have to cope with the increase in the number of heat waves, their duration and their intensity, as illustrated by France’s heatwave episode of 2019. Improving the quality of urban life and maintain attractiveness are thus becoming the challenges of tomorrow for today’s communities.
Heat in the city: multiple factors
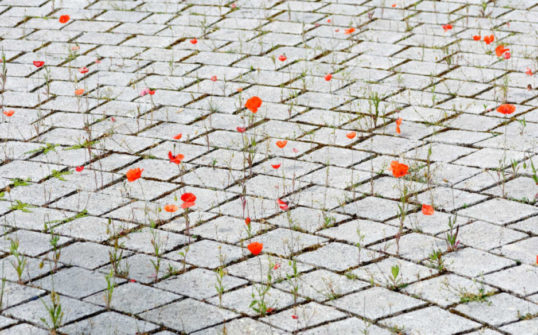
Why do some daytime hot spots persist on night-time thermographies, while others disappear? This is in part due to soil sealing and the thermal properties of materials used in construction and roads. Asphalt-covered spaces such as parking lots, storage facilities and streets store energy during the day and release it at night in the form of heat. Each surface has a distinct light-reflecting capacity which can be measured by an indicator: the albedo.
Based on the color and roughness of a surface, an albedo index ranging from 0 to 1 is assigned; the higher the index, the more the surface is prone to reflect incident light back into the atmosphere. For example, a paved road has a low albedo – between 5 and 10% – as has a dark-colored roof. Conversely, walls painted in light colors reflect between 50 and 90% of the incident luminosity. This phenomenon is exacerbated at the Earth’s poles, as snow can reflect up to 90% of the light.
While land use analysis is crucial to comprehend the urban heat island phenomenon, other criteria must also be taken into account, as street orientation or space configuration and density. For example, narrow streets will not foster air circulation, rather let it stagnate on a clear day, thus increasing the heat effect. Another parameter is the area of homogeneous spaces. Large waterproofed surfaces have higher surface temperatures than smaller surfaces of the same nature.
Finally, the concentration of human activities is greater in the city than in the countryside. Industries, lighting and transport contribute to the rise in pollution and temperatures.
Urban cool island : an oasis in the city
Urban green spaces and water points are sources of coolness and provide a feeling of protection and relaxation. They also supply shade and reflect light among many benefits. Did you know, for instance, a tree, when strategically positioned, can bring about a 2 to 8 °C decrease in air temperature ? This is in part due to a process called evapotranspiration. Under the effect of heat, plants send water to the atmosphere through the soil and leaves, thus cooling their immediate environment.
By sequestering carbon, trees and plants mitigate the effects of climate change. They also act as filters against pollution by absorbing certain fine particles released by human activities. The presence of vegetation in the city reduces the intensity of heat islands. This is why different proportions of green space between two neighborhoods can explain temperature differences.
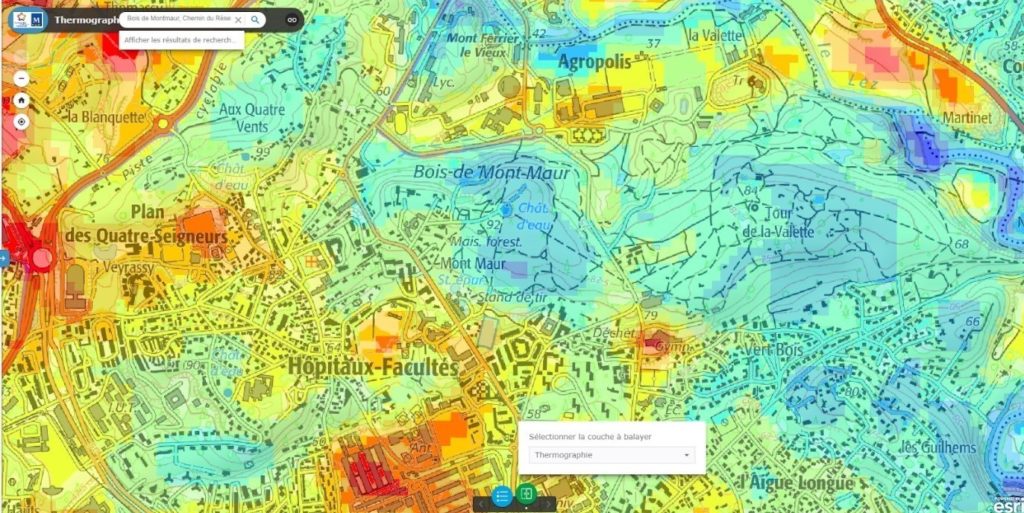
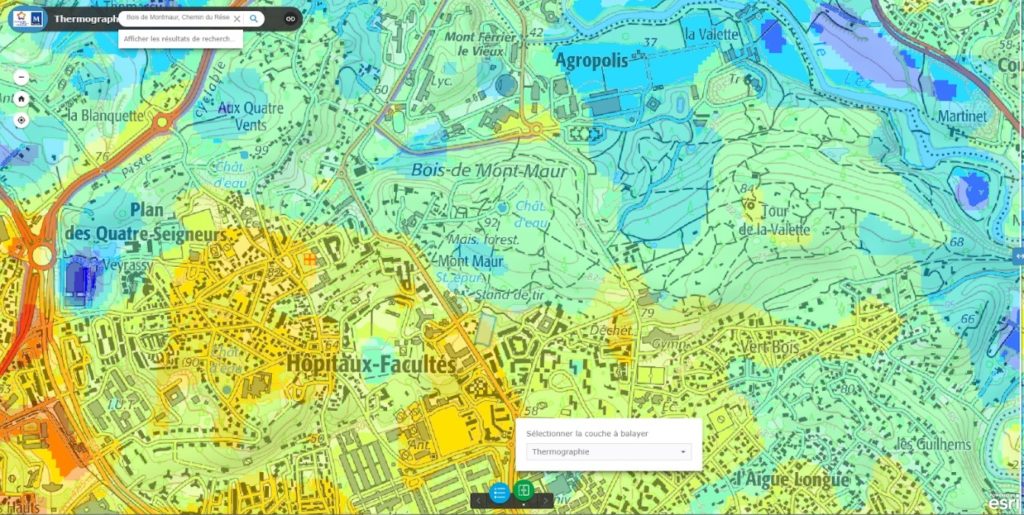
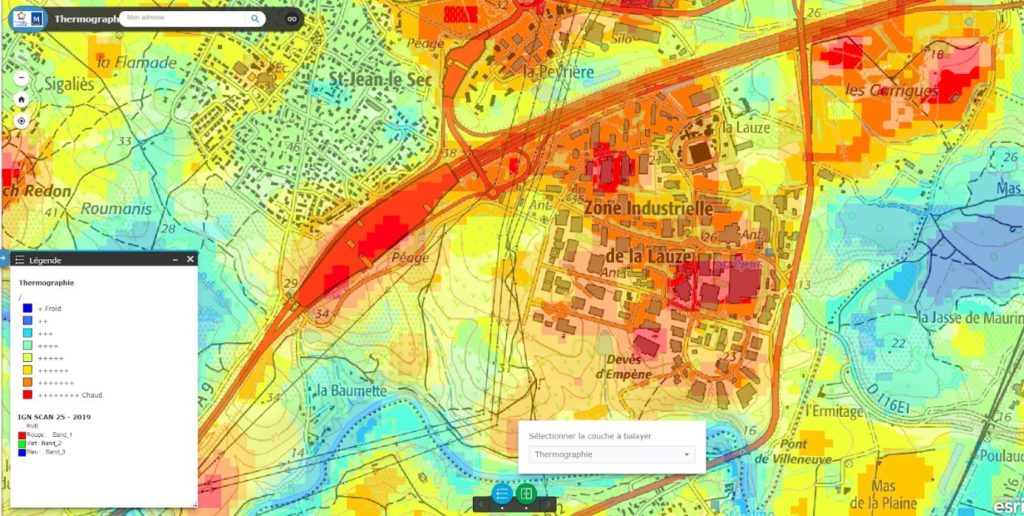
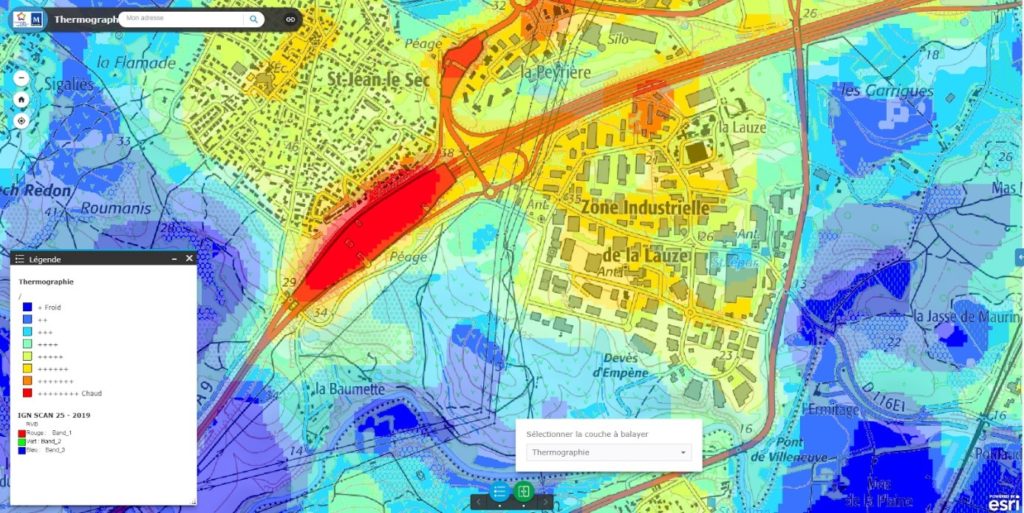
On these two thermographies, one of Montpellier’s main islands of coolness stands out: the Bois de Montmaur. Day and night temperatures remain cool in these woods, unlike carriageways, which continue to release heat at night.
While revegetation is essential to attenuate heat island effects, it is the entire urban environment that must adapt and integrate climate issues into its developments. From the buildings’ configuration, height and coatings to wind circulation, shaded and sunny spaces, all the components of the city must be considered in order to find economical, ecological and feasible solutions. By favoring materials enabling water to pass through, we help soils filter so-called polluting components but also accumulate water reserves for the development of plants, especially useful during hot periods. Other solutions should be implemented along, such as actions to contain traffic and encourage soft mobility : it is indeed by changing several parameters at once that significant changes will be observed.
Yet other solutions exist. In southern Europe, in New York or in Brest, the roofs of buildings are painted in light colors. These white coatings help drastically reduce surface temperatures, while achieving 3 to 7 ° C decreases indoors. Their aconomic and ecological benefits have long been established. Sometimes the issue is just about convincing decision-makerds that regional identity can be found elsewhere than on the rooftops.
According to the IPCC (Intergovernmental Panel on Climate Change), over the coming decades, the Earth’s surface temperature could increase by 1.1 to 6.4 ° C. The situation is urgent and commands answers that are just as urgent.
Heat islands in Montpellier: Marc Aparicio’s take
Marc Aparicio is the head of Montpellier’s GIS or Geographic Information Service (Observatory service of DICOSIG at Montpellier Métropole’s Department for Sustainable Development and Planning). This is an expert service charged with pooling geographic data and facilitating their analysis and communication. This implies making geographic data available on repositories at various scales.
Montpellier Méditerranée Métropole is exposed to heat waves on a regular basis. This translates in a an average 29 days per year above the 30 °C mark, and an average summer temperature of 28.2 °C (according to data from Météo France). At the end of June 2019, an all-time high of 46 °C was recorded in the vicinity of Montpellier, in the Hérault and Gard départements. It was in this scorching context that the Metropolitan GIS service consulted Kermap. The city requested a homogeneous, coherent satellite thermography of its whole metropolitan area. The analysis of thermal satellite images indeed provide a first approach to the observation of thermal disparities.
Kermap’s work was based on two satellite images : a day LANDSAT 8 image acquired on July 22, 2019 and an ASTER night image dated July 6, 2015. The spectral band corresponding to thermal infrared was used to observe the temperature gradients at metropolitan level. The images were then recut to fit the urban sprawl, as the aim was to focus the interpretation on the sole urban environment. To translate surface temperature in degrees Celsius , Kermap applied a pre-treatment to the thermal images. In this analysis, the thermal gradient was rendered in relative temperature so as to highllight thermal amplitude.
Marc Aparicio welcomed this first mapping as a starting point to understand the heat wave pattern in the Greater Montpellier area in general, and to understand the urban heat island phenomenon in particular. “A map makes it possible to raise awareness and objectively become aware of a spatial and temporal phenomenon that is often understood subjectively. We can then establish correlations, for example, between thermography maps and the typology of urban forms”. Such data helps develop an internal understanding of the territory, followed up by educational tools for information and awareness. For example, this data was presented to the general public during the Métropolisme festival. Beyond the sole analysis and interpretation process, Kermap also provides support services to facilitate appropriation by public authorities. Several modifications were made throughout the project in order to achieve a result that specifically met the expectations of Montpellier Métropole.
Analyzing day and night gradients made it possible to locate the hottest and coolest spaces in the city and shed light on the city’s thermal inertia zones. These spaces are resistant to temperature changes, unlike others that appear on maps as hot spots day and night alike. These areas store energy and release it as heat at night, preventing the city from cooling down and affecting the comfort of its residents.
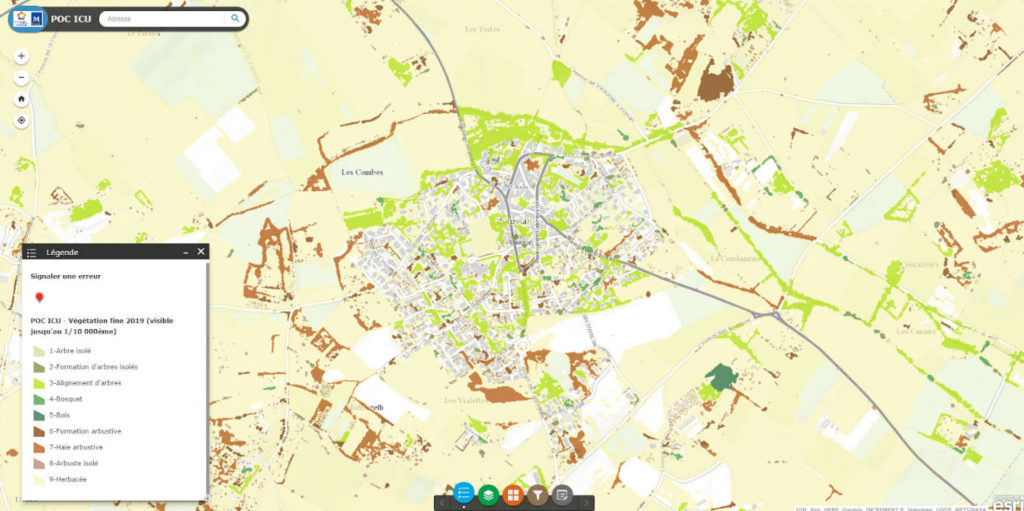
Kermap is currently performing two more jobs for Montpellier : climate-oriented land-use mapping climate and high-detail vegetation mapping. Their aims are to refine knowledge of the territory and to achieve greater precision areas in the determination of urban heat island risks, using the “Local Climate Zone (LCZ)” method. The existing inventory will be supplemented by vegetation present in private homes and on the outskirts, in order to obtain a more accurate green map of the city. In addition, one of the aims of the project is the planting of trees within the city.
Once validated, this data will be open to everyone on Montpellier’s open data portal.
Urban climatology, vegetation… Our services help you draw the path to improved quality of life in the city. Let’s have a talk !