Climate change in 2021 : a view from the cities
A few days from the end of a year that might be historic, let's have a look back at 2021's climate in 24 cities across the world with Klover.

Yann Daoulas
How is climate change impacting the world’s big cities ? Are these metropolises green enough to face these upheavals ? Thanks to Klover, Kermap’s new platform to monitor urban vegetation and climate, here are some insights into these questions crucial for urban resilience
Global warming at work in 2021 ?
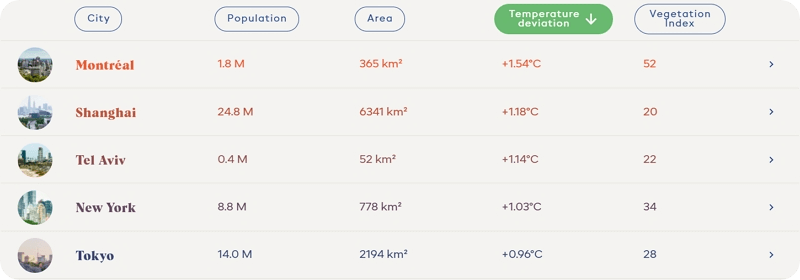
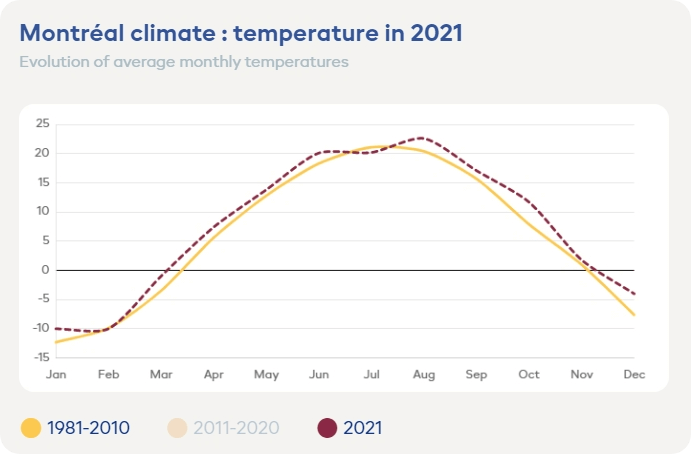
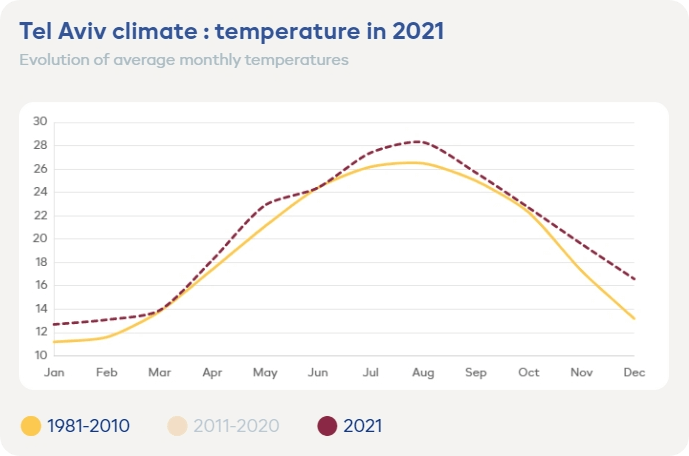
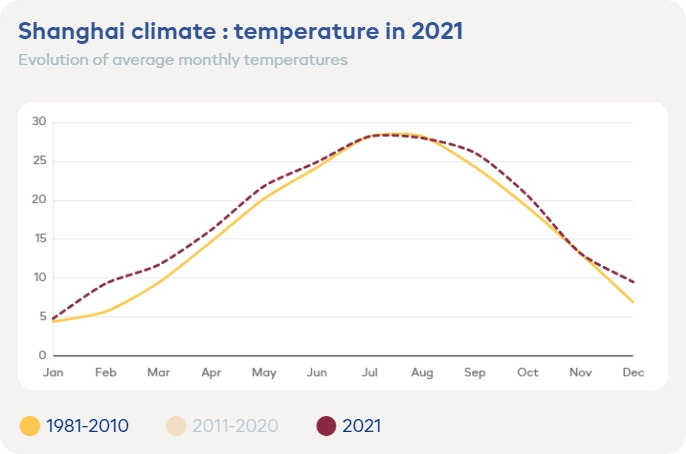
Which cities in the Klover panel recorded the most unusual temperatures in 2021 ? Compared to the 1981-2010 baseline, the biggest deviation was observed in Montréal, with an average +1.5°C over the year. Next are Shanghai, Tel Aviv, New York and Tokyo, slightly above or below the +1°C mark.
At the other end of the rankings, Bangkok posted the biggest downward variation: -0,5°C on average over the whole year. This amounts to a deviation two to three times smaller in amplitude than that recorded in the top 5 cities.
Interestingly, Montréal’s and most of the other top 10 cities’ temperature curves almost perfectly fit the shape of the baseline throughout the year, albeit always a notch above. This is what we learn from our temperature evolution indicator, based on daily-updated data from the Nasa Power programme, like any climate data available on Klover.
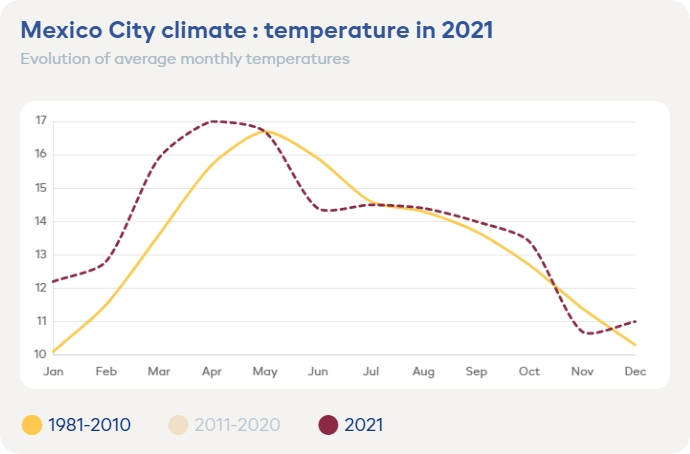
One exception though: Mexico City, where temperatures were indeed higher than usual in the first half, but then yo-yoed across the baseline level. However, the Mexican capital was no exception to another trend observed among the top 10 cities. All of them record 7 to 20 additional days of abnormally high temperatures in 2021, ie. days when maximal temperatures exceeded the baseline’s average maximal mark by 5°C or more.
Other cities also parted ways from the baseline curve, though not as much as Mexico City. Especially European ones like Paris, which experienced successive ups and downs in temperature deviation this year. As a result, the average annual deviation was negative for almost all of these ten or so metropolises by the end of 2021.
👉 More details on Klover – vegetation and climate in Paris
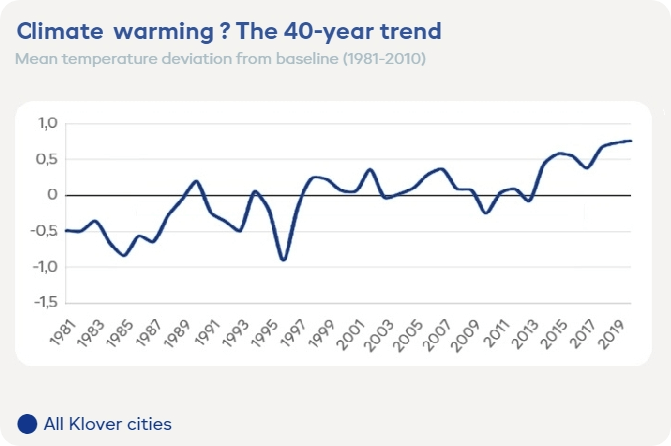
Atypical as they may seem, those figures remain one-year occurrences, which will of course tend to diverge from a 30-year average. Using them to assert that such or such evolution in 2021 was caused by global warming would be risky at best. One needs perspective over a longer period of time to observe a significant trend.
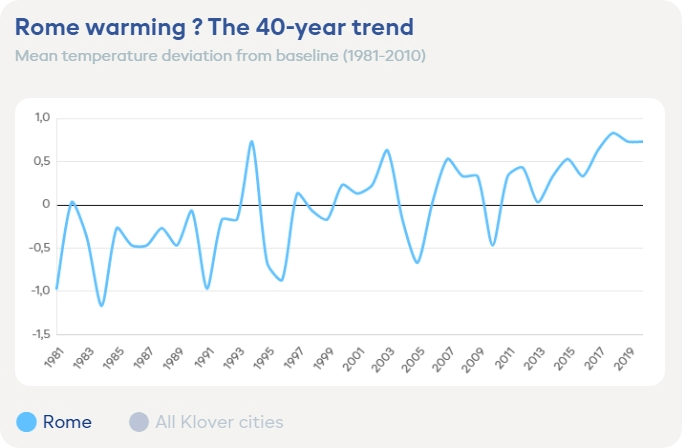
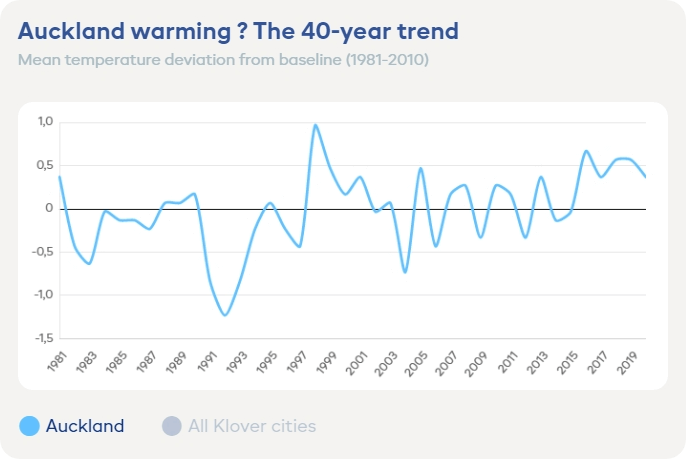
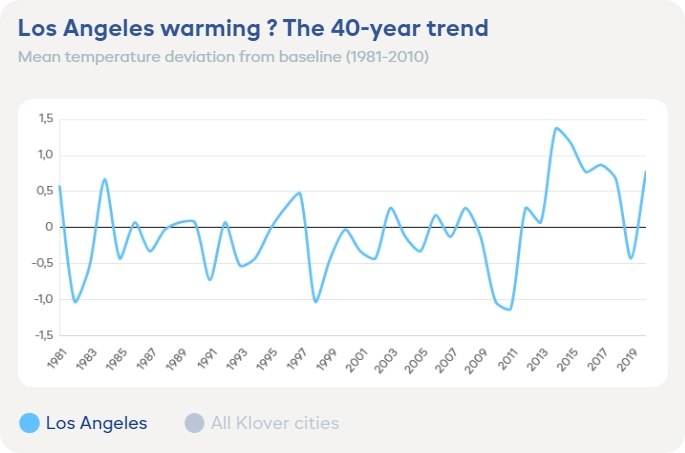
As a matter of fact, another indicator provided by Klover does just that. Temperature deviation from baseline is indeed also available in annual series since 1981. And it does suggest a tendency to global warming over the past twenty years, and even more visibly over the past ten years. Among the 24 cities monitored in Klover, only Delhi and Capetown seem immune to this general upward trend:
Climate in 2021 : temperatures through the roof
The past 12 months have supplied their fair share of exceptional events. And one of them has left a deep impression on climate observers all around the world: the apparition of a “heat dome” of unprecented vigor above the Western part of North America. The event notably led to the quasi integral destruction by fire of a town, Lytton, shortly after it had set the all-time heat record in Canada, an unbelievable 49.6°C.
This was the apex of a historically hot month of June, so out of proportions that it was estimated by the World Weather attribution to be a 1 out of 1,000 year event in today’s climate. This episode was also a historic one for Vancouver, the capital of British Columbia, located 250km north of Lytton, as suggested by figures compiled on Klover:
- A temperature record: 38.7°C on June 28, 2021, beating the highest mark in the past 40 years by a staggering 5°C
- Average temperature in June 3°C higher that that of the baseline (1981-2010)
- 10 days of abnormal heat in June (maximum temperature higher than baseline by 5°C or more), vs a 4-day average during this month over the past 40 years.
👉 More details on Klover – vegetation and climate in Vancouver
This unprecedented phenomenon has helped consolidate climate change as an undisputable process, but also as an imminent threat in the eyes of the world. All the more since it was not the only climatic aberration during this historic year. Worthy of mention are also:
- The polar vortex which gripped the southern part of the US in February, with temperatures dropping near the -20°C mark
- The heatwave which struck southern Europe in August, setting the stage for a new all-time temperature record in the old continent (48.8 °C in Sicily), while unprecedented wildfires were wreaking havoc in Greece’s Euboea island.
- Historical heat surges on the Arctic circle throughout the year, with temperatures exceeding normal marks by 10 to 20°C, and an absolute record of 38°C in Verkhoyansk (Russia) on May 19, 2021. These conditions most certainly helped fuel the wildfires that devastated Siberian forests, especially in the Russian province of Yakutia.
- An exceptionally hot summer in Moscow, where an all-time temperature record for any month of June was set, and average temperatures in June, July and August exceeded the baseline by 2°C.
- Another giant wildfire in California, dubbed Dixie Fire, which ended up the second biggest on record in this state affected by chronic drought. In 2021, only 24 days of rain were recorded in Los Angeles, while full-year cumulative precipitation reached a mere 150 mm (2.5 times less than baseline)
As evocative of incoming systemic disruption as this – non-exhaustive – list may be, experts tend to be cautious when asked if climate change could be the cause of these exceptional events. A sure thing, however, is that they will be less and less exceptional. “Human-induced climate change is already increasing the frequency and intensity of many weather and climate extremes in every region across the globe”, the Intergovernmental Panel on Climate Change (IPCC) indeed warned in its 6th assessment report released in August.
Record floodings on all continents
Less than six months after the heat dome episode, British Columbia experienced another climatic calamity: massive floods caused by an unusually powerful phenomenon known as an atmospheric river. All of this happening in a no less exceptional context set by record cumulative rainfall between September and November 2021.
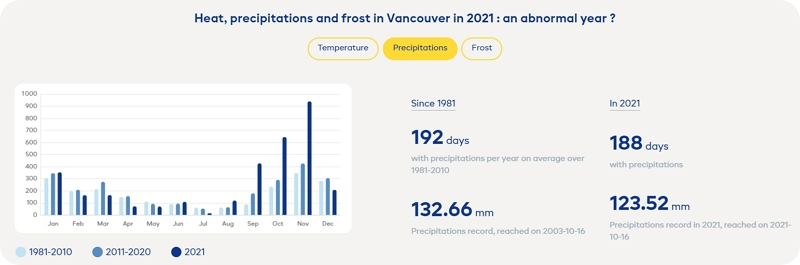
A look at Vancouver’s precipitation data will help grasp the magnitude of this anomaly: over this three-month span, the city received an amount of rain (in mm) equivalent to the full-year precipitation average of the 1981-2010 baseline.
With these two unprecented events striking the country within a few months, Canada ministry’s for Environment made it plain that things would likely not get better from there:
We have gone from some extremes to other extremes and, unfortunately, this is consistent with what climate change has been projected for all parts of Canada.
It’s not to say that it’s always going to be this extreme all the time. We will see lulls, of course, but the frequency, the amplitude of these events … will continue to increase with the coming years and decades.
Armel Castellan, meteorologist at Environment and Climate Change Canada, cbc.ca, December 1, 2021
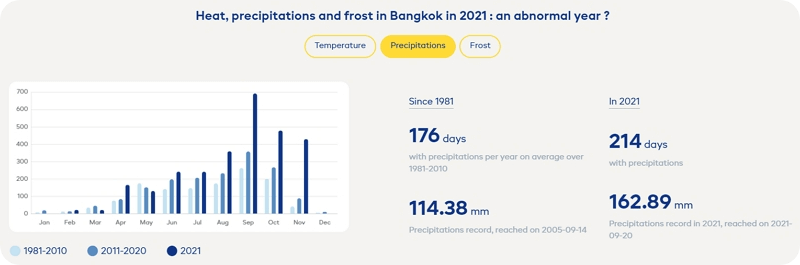
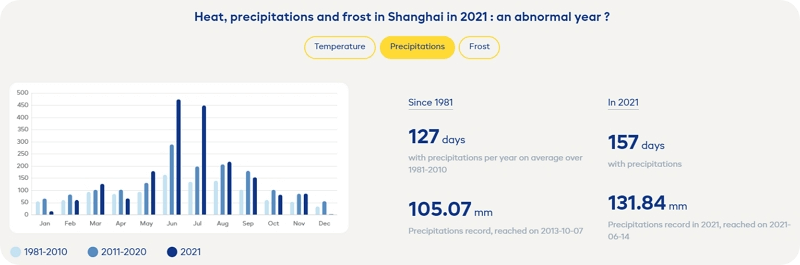
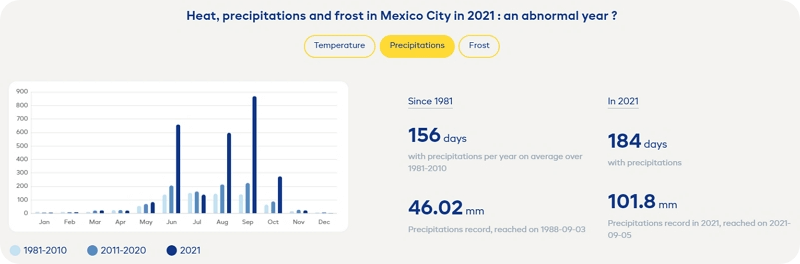
Canada’s deadly flash floods are the most recent of a tragic series in 2021, which also saw part of Western Europe drown under exceptional rainfalls in mid-July, especially Germany, Belgium, Luxembourg and the Netherlands. The same scenario unfolded ten years later in China’s Henan province and its capital Zhengzhou, or in India, where Delhi struggled with massive downpours in July, then again in August. In addition to these floodings, data collected on Klover suggest some cities experienced significant precipitation anomalies during the past twelve months. Figures for Bangkok, Shanghai or Mexico City show:
- 28 to 38 more days with precipitation compared to baseline average
- Cumulative rainfalls 3 to 5 times above some months’ average in the second half
- 40-year records shattered for one-day precipitation
Extremes episodes, lasting anomalies… Could such exceptional rainfalls result from climate change ? Despite increasingly solid ground for suspicion, there also, climate scientists thread with caution. Based on current knowledge, they often warn, one cannot say that these events are directly caused by climate disruption, only amplified by it. But definitely made worse by land take and artificialization, an undisputed recipe for disaster proven to hinder rainwater infiltration, also dubbed as “soil sealing”.
Climate change: cities at the forefront
Will 2020, and even more 2021, be landmarks on the path to environmental awareness ? Too soon to tell yet, as was shown by the frustrating agreement found at the COP26, disregarding both a cascade of climatic aberrations and the IPCC’s stark warning issued a few months before.
However, climate concern has undeniably grown to new dimensions as disasters pile up, climate anomalies become more conspicuous and threats to biodiversity multiply. It has taken near-live observation of disruptions for Man to become aware of its planet’s vulnerability. Likewise, it has taken warnings by scientists that part of climate change is “irreversible” to admit that this long-term disaster is today’s emergency already.
At the forefront of this now inevitable climate disruption are cities. First because they have not been thought up to face such risks, but also because they will be home to two-thirds of the world’s population by 2050, according to UN projections. Their number one concern now: resilience. Metropolises around the world are thus bracing for extreme climatic events both more frequent and intense:
Some increase in climate risk is already locked-in due to existing emissions, and risks will be significantly worse if action to mitigate climate change falls short of the goal to limit warming to 1.5°C.
To protect the lives and livelihoods of urban residents, cities must adapt and improve their resilience to current and future climate impacts.
Focused Adaptation: A strategic approach to climate adaptation in cities, July 2021, C40 Cities Climate Leadership Group / McKinsey Sustainability
Climate change adaptation through greener cities
Metropolises have various options at their disposal to achieve that goal. One of them is making the city green – or green again. Especially with trees. Vegetation is one of the most efficient and affordable solutions to fight urban heat islands, the C40 Cities climate leadership group insists in the aforementioned report
But there is more to greener cities than the fight against heat. As flooding risks increase, some experts also advocate the “sponge-city” principle, relying on urban forests to facilitate rainwater infiltration.
And the list of ecosystemic services provided by urban vegetation does not stop there: biodiversity presevation, better air quality, carbon capture, and generally speaking, a more pleasant city to live in…
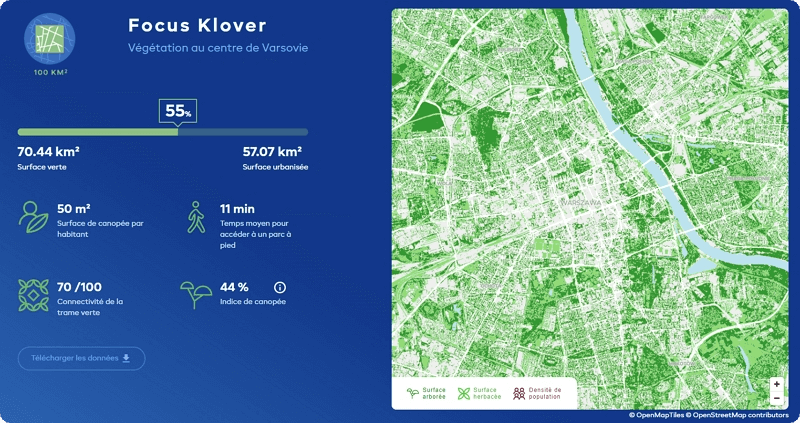
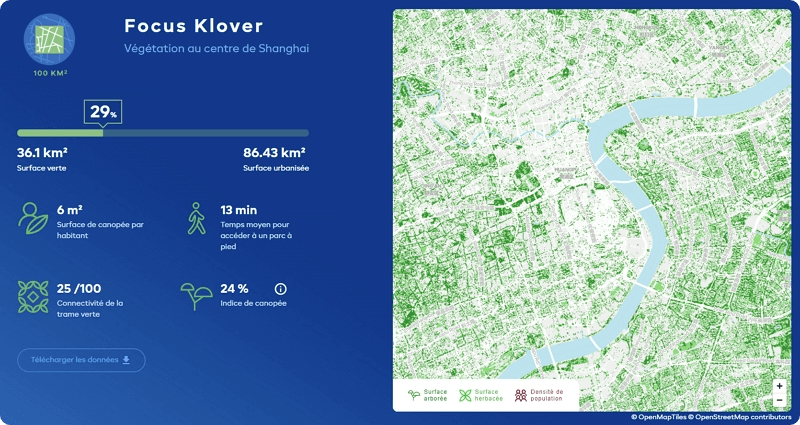
Unsurprisingly, as far as room for trees and green spaces is concerned, there is a variety of situations among the 24 metropolises analyzed on Klover. Maps are based on Airbus’s Pléiades satellite images provided by France’s National Center for Space Studies (CNES).

Klover Focus : Warsaw’s tree and vegetation map 
Klover Focus : Shanghai’s tree and vegetation map

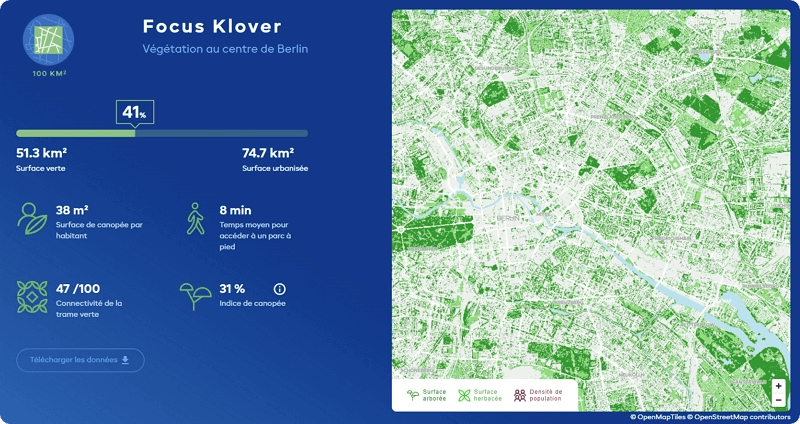
Klover Focus : Berlin’s tree and vegetation map Klover Focus : Paris’s tree and vegetation map
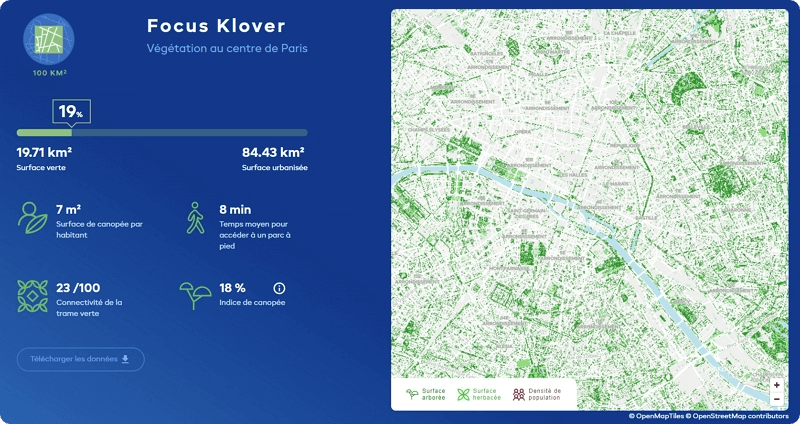
Some, of course, are better suited for greenness than others. Climate, geography, morphology, demographics, history, economy are among the many influences that helped shape these cities, especially their bond to nature. Take Paris, for instance: it is the world’s seventh most densely populated city, with over 20,000 inhabitants per sq. km. Meaning it is 25 times denser than Montréal, which has the same population count, or Zurich, which as roughly the same area. This is but one example of th diversity of contexts that will be encountered in cities analyzed by Klover.
And then there also are disparities within cities, blurred by overall indicators ; typically between a very green city centre and peripheral districts sometimes almost totally deprived of vegetation or canopy. Reducing such inequalities between their citizens is another part of the challenge taken up by metropolises engaged in ecological transition and climate adaptation.
Space intelligence for climate resilience
Cities at either side of Klover’s green rankings have all worked out climate change adaptation strategies and/or launched greening programs. Their aim is to improve resilience through nature-based solutions, but these cannot be implemented randomly. In order to design their greening plans, municipalities need extensive knowledge of existing vegetation in public and private premises. These have to be precisely mapped, then also analyzed and modelled for cities to optimize their actions.
Such needs can be met today by innovative technologies to process satellite imagery or aerial photographs. With its cutting-edge artificial intelligence techniques and geospatial analysis expertise, Kermap delivers precise and extensive tree and vegetation mapping that was once complex and time-consuming to acquire. Our aim is also to provide this information in the most user-friendly fashion, as illustrated by maps and infographics of the 24 cities featured on Klover. Another example is our Nos Villes Vertes platform, which provides maps and statistics on the tree population for each and every town and city in continental France. These are but a couple of examples of how we are able to turn Earth observation data into understandable, actionable information for climate resilience, by producing, analyzing and facilitating access to this precious knowledge.
We are already helping many cities and local authorities take up the climate challenge. What about yours ?