


Launched in 2021
Online
24 cities
Klover
Urban vegetation : 24 cities facing climate change
Among Kermap’s areas of expertise is urban vegetation. This is a major stake for cities in their bid to improve the quality of life of their inhabitants, especially by alleviating the impacts of climate change. We tackled the issue two years ago by mapping all of continental France’s tree canopy, in public as well as private spaces. These information, maps and statistics are available in open access on the Nos Villes Vertes website, giving every French citizen an opportunity to asses the greenness of the city and neighborhood they live in.
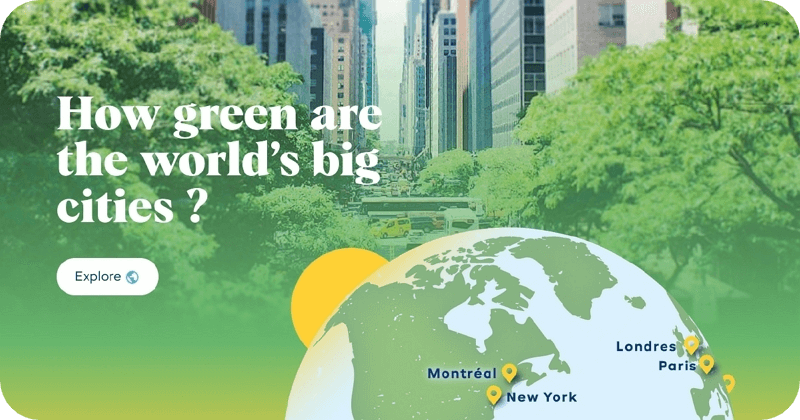
But we wanted to wander further. This is why we made Klover, a platform to see how much room vegetation gets in some of the world’s biggest cities. Precisely 24 of them across the globe, from Auckland to Zurich through Capetown, Mexico City or Delhi.
Measuring greenness in these major urban landscapes, while gauging how the reality of climate change sinks in day after day: that is what we want to achieve with Klover. The aim with this platform is to raise awareness among leaders and the general public about the environmental challenge facing large urban areas in the decades to come. And also to show how Kermap’s skills and expertise in geospatial analysis can be part of the solution.
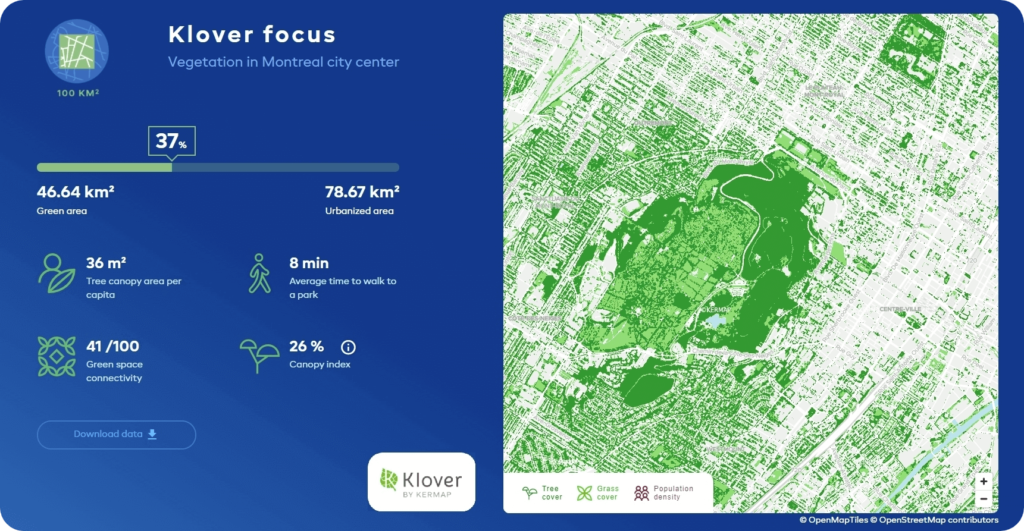
Specifically, our intent is to demonstrate that, thanks to satellite images and artificial intelligence processing, knowledge of city greenness can be greatly improved. Our innovative machine-learning methods have helped us produced detailed vegetation maps in a 100 sq. km area at the heart of each city. Another layer of analysis resulted in the extraction of contextual indicators. These are simplified examples of the kind of information which can be extracted from satellite data and used by land planning professionals for urban diagnoses or monitoring purposes.
This work was conducted on the 24 cities under study in Klover, based on Airbus’s Pléiades satellite images, supplied by France’s National Center for Space Studies (CNES).
Greening cities against climate change
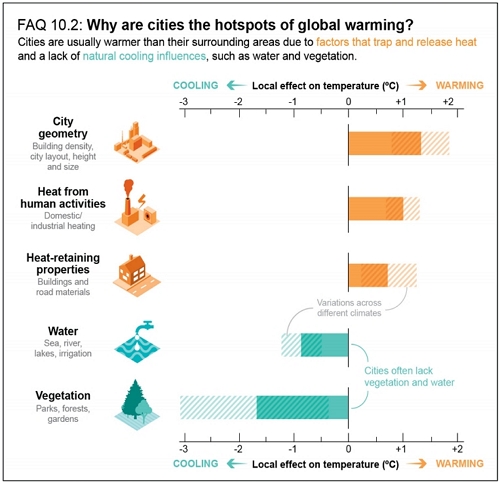
No one argues against the benefits of urban vegetation: biodiversity preservation, carbon sequestration, reduced air pollution, improved well-being and health… But one is of particular interest for cities: the fight against extreme heat. In order to mitigate urban heat island effects, vegetation plays a major role, the IPCC or Intergovernmental panel on climat change, insisted in its report released in August 2021:
A few weeks before, the C40, an organization gathering dozens of the world’s biggest cities teaming up against climate change, also stated that planting trees was one of the easiest and most efficient actions to fight urban heat. This was one of the main findings of a report released in July 20201 with McKinsey Sustainability.
Planting trees is a simple solution for large metropolises to protect their population during extreme heat periods. Especially as those are bound to be more frequent, so much so that C40 now advocates adaptation and improved resilience. “Given existing emissions, some cilmate change is arleardy locked in, making these risks unavoidable”, it writes in the aforementioned report. Meanwhile, the IPCC has no doubt that “future urbanization will amplify the projected air temperature change in cities regardless of the characteristics of the background climate”. And thus warns that “large implications are expected from the combination of future urban development and more frequent occurrence of extreme climate events, such as heatwaves”.
This is why we wanted Klover to also provide meteorological insights, in order to better comprehend the magnitude and impact of climate change in the 24 cities under study.
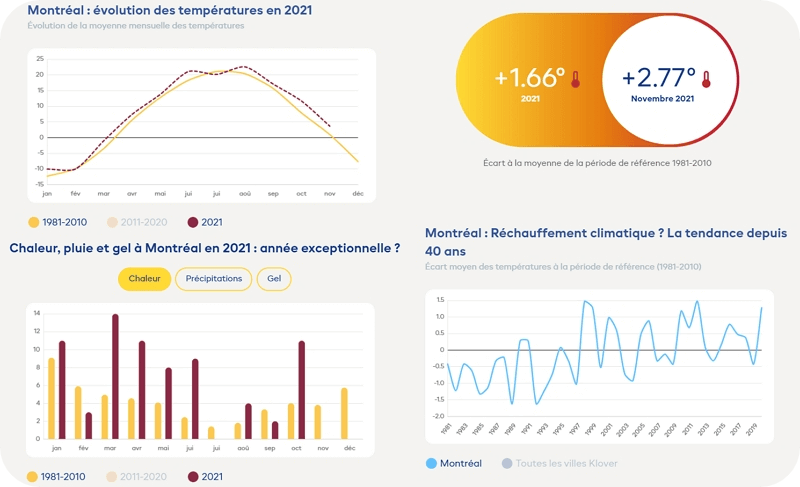
Temperature and precipitation data during the last 40 years provide perspective on longer-term climate evolution in these 24 cities and tend to confirm a warming trend, especially in the past decade. Klover also provides climate data updated daily to monitor anomalies and trends during the current year, compared to the 1981-2010 baseline. An observation: Montréal is the city where deviation from the 30-year reference period has been the most significant so far in 2021: an average +1.66°C from January 1 to November 9. To be continued…